The 2020 Integrated System Plan (ISP)

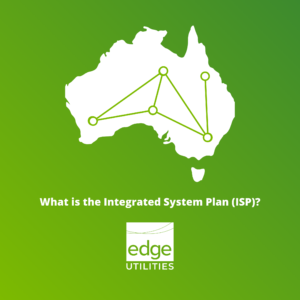
What is the Inegrated System Plan?

The Australian Electricity Market Operator (AEMO) recently published the 2020 Integrated System Plan (ISP) which is intended to maximise the value to end users by developing the market through an optimal development pathway. The ISP was endorsed by the Council of Australian Governments (COAG) Energy Council in 2018, and has since guided governments, the industry and consumers on investments needed for an affordable, secure, and reliable energy future.

The ISP is a 20-year roadmap for the National Electricity Market (NEM) and is updated by AEMO every two years with their response to the latest technology, economic, policy and system developments. The report identifies investment choices and recommends essential actions to optimise consumer benefits. Although the report is published by AEMO, they are not the only party to have an input in the ISP. In preparation of the 2020 ISP, an 18-month consultation program took place where over 200 stakeholders were consulted, 8 workshops were held, 3 webinars were hosted, and 85 written submissions were provided.

The 2020 Integrated System Plan

The 2020 ISP is expected to deliver approximately $11 billion in net market benefits to the NEM the next 20 years. These benefits come together with the market reform which is currently aiming to attract investments and optimise markets outcomes. The market reform is being coordinated by the Energy Security Board (ESB) with market bodies such as the Australian Energy Regulator (AER), Australian Energy Market Commission (AEMC) and AEMO.

It has been highlighted in the 2020 ISP, that as the generation mix changes with the retirement of coal generation, the least-cost transition should be through Distributed Energy Resources (DER), Variable Renewable Energy (VRE) and investment in transmission infrastructure. DER is expected to double, if not triple, providing around 13-22% of the total underlying annual energy consumption. Although, more than 26 GW of new VRE is needed to replace 63% of coal-fired generation that is set to retire.

Dispatchable resources between 6-19 GW are also needed to back up the renewable energy generators. These dispatchable resources will be in the form of utility-scale pumped hydro, fast responding gas-fired generation, battery storage, demand response and aggregated DER participating as virtual power plants. It was also highlighted that there is a growing need to actively manage power system services such as voltage control, system strength, frequency control, inertia, ramping and dispatchability.

AEMO’s Forecasted Projects

To achieve the desired results, there are several projects outlined in the 2020 ISP that were broken down into committed projects, actionable projects, actionable projects with decision rules and future projects. The committed projects are aiming to address cost, security and reliability issues and have already received regulatory approval. The South Australia system strength remediation is one of these projects, which will see the installation of four high-inertia synchronous condensers and is on track to be completed in 2021.

The Western Victoria Transmission Network Project is a two-part project due to be completed in 2021 and 2025 to support generation from the Western Victoria REZ, including new 220 kV and 500 kV double-circuit lines. The last of the committed projects is the QNI Minor which is set to be commissioned in 2021-22 and will involve a minor upgrade of the existing interconnector, adding over 150 MW thermal capacity in both directions.

Actionable Projects

The actionable projects include a minor upgrade to the existing Victoria ‒ New South Wales Interconnector (VNI), which is expected to be complete by 2022-23. There will be a new 330 kV double-circuit interconnector created between South Australia and New South Wales which is due to be complete by 2024-25. In the same year, the Central-West Orana REZ Transmission Link is set to spark network augmentations to support its development. In 2025-26, there will be a 500 kV transmission upgrade to reinforce the New South Wales southern shared network and increase transfer capacity between the Snowy Mountains hydroelectric scheme and the region’s demand centres.

Two projects that are actionable with decision rules are the VNI West project and the Marinus Link. VNI West is a new High-Voltage, Alternating Current (HVAC) interconnector between Victoria and New South Wales and the Marinus Link involves two new High-Voltage, Direct Current (HVDC) cables connecting Victoria to Tasmania, each with 750 MW of transfer capacity and associated alternating current transmission.

Future Projects

Some of the future projects include Queensland to New South Wales Interconnector (QNI) Medium and Large interconnector upgrades, three additional Queensland augmentations, three New South Wales augmentations, and two South Australian augmentations.

AEMO has forecasted a great deal of change to the NEM and Edge is looking forward to seeing the progress of the upcoming projects.


Written by: Alex Driscoll (Senior Manager, Markets and Trading)


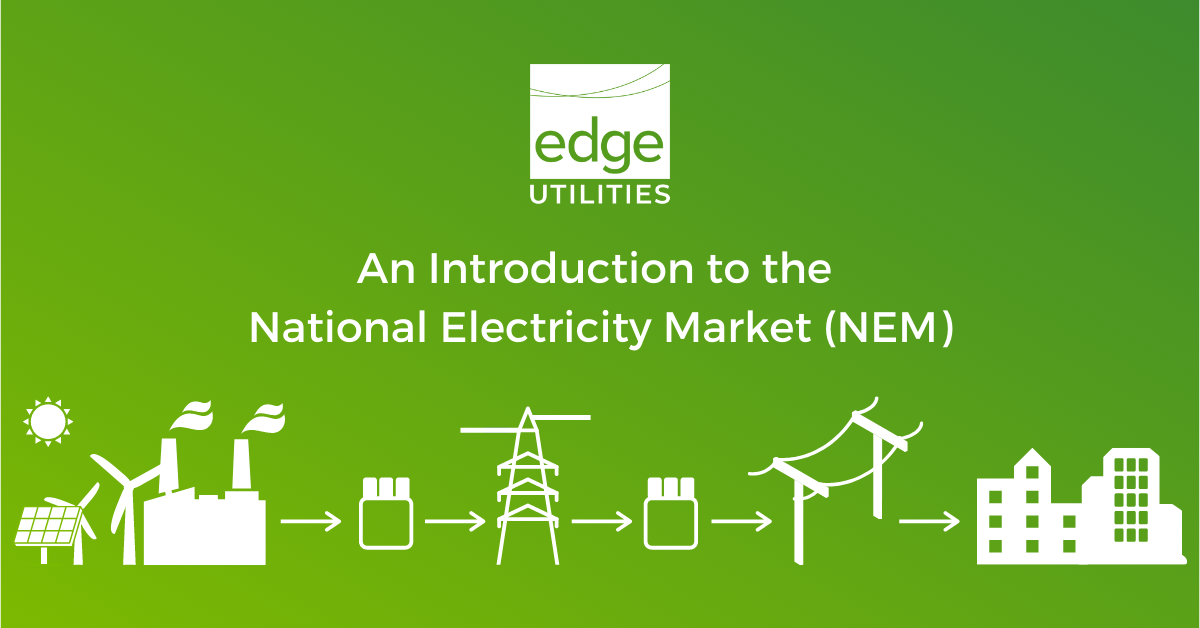
To learn more about the National Electricity Market (NEM), read our educational article: https://edgeutilities.com.au/an-introduction-to-the-nem/

Quarterly Report – Q120

2020 Edge Utilities First Quarter Report

The world has certainly changed in the last six months. So many aspects of our lives have been altered by something we can’t control and left us wondering if things will ever go back to normal. While this has brought trouble and uncertainty, it has also given us a chance to pause. At Edge Utilities, we’ve used this time to re-think how we can help businesses, Strata and Body Corporates take back control of their utilities contracts.

We’ve refined our offering, and our brand. And we’re standing by to help you secure the best value utilities solutions on the market.

The first quarter of 2020 (Q120) has seen the lowest wholesale electricity and gas prices in the National Electricity Market (NEM) since 2016.

Key Drivers:
  • East coast wholesale gas prices averaged $5.63/GJ, down from $9.75/GJ in 2019
  • Power system events result in higher system costs
  • Falls in Electricity futures
  • Weather
  • NEW Spot Prices
  • Electricity Demand
  • ASX

When we think of our electricity bill, we think of the cost of the electricity we are using as the cost we pay our retailer. But this is not the only portion of your bill.

Electricity costs are made up of several elements, retailer energy costs, environmental liability, network costs, market costs and metering costs. Some of these are within your control and some are regulated and pass through to the end user.

You can pay more depending on your geographical location, payment method and the type of tariff you are on. In this article we will investigate each of these cost elements and what we can do to help you manage your bill.

Are you ready to Re.Think your utilities contracts to save money and get better value?

Download a copy of the full Quarterly Report here: Edge Utilities – Quarterly Report – Edition 1


To keep up-to-date with Edge Utilities, connect with us on LinkedIn: https://www.linkedin.com/company/edge-utilities/

Queensland’s Quarter Two: The fizzle without the firework

Queensland Quarter 2 2020

In the first quarter of 2020 (Q120), the Queensland average spot price dropped to its lowest levels since Q116 averaging $54/MWh. The market sentiment was that the generators were already running at, or just above losses and this could not be sustained, yet along came Q2 to buck the trend and average at $34/MWh over half of what the Quarter 2 out turned in 2019.

COVID-19 Impact

Although the COVID-19 impact on demand was mild in comparison to what was forecasted for, in Q1 Queensland dropped only 1% in comparison to the NEM’s average of 5%. The continuing lockdown into Q2 has affected this further, eroding around 3.5% off the demand year on year. This ongoing pandemic and change in behaviours have accelerated the appearance of the super peak that has been widely forecasted, with the increase in large and small-scale renewable uptake. AEMO believe in comparison to Q119 the daytime rooftop PV increased by 524MW to a total of 3,023MW. This, coupled with the shorter winter days not affecting the evening demand periods which have remained at the usual levels, has allowed the super peak to appear.

To help facilitate this new shape in April, Snowy Hydro traded the first OTC Super-Peak Swap through the Renewable Energy Hub. This will open the opportunity for those technologies which can bridge the Solar ramps. However, future trends could have wider impacts, couple the price reduction of these technologies with possible future demand load reductions, we could see the trend of these daytime lows and increase across these super peaks sooner rather than later, the ducks will deepen!

The lessons we can take from the wider impacts of COVID-19 could also in the short term create un-foreseen impacts which would be felt by the market. For example, operations at the world’s deepest gold mine in South Africa had to be ceased at the end of May due to a Coronavirus outbreak within the mine, whilst contact tracing and sanitisation of the mine could be undertaken. This was following a mandatory shutdown in March of all mines within South Africa. If something similar was to happen within Queensland the impacts on price would be widely felt.

The Australian Energy Market Operator (AEMO)

On a broader scale, without adequate storage to allow for intraday and intra seasonal demand curves, prices have already shown how at times of low demand but, high renewable generation there is a significant depression in prices, sometimes going negative. The latest rounds of constraints show AEMO are not yet adequately prepared to handle this and further changes will be made.

This argument therefore gives credibility to the viewpoint that with much of Queensland daytime power now coming from renewable sources and no drop in the demand or increase in interconnector capacity, there could be significant pressure on futures prices forcing the curve into backwardation. How the large and fast-cycle plants which are providing spinning reserve react to this in their merit orders and BOAs will determine the cost this will have to the industry, especially on the morning and evening ramps until a bridging technology can be developed at scale.

In the short term having significant solar on the system leads to a deepening duck curve being produced and the potential for markets capping out on the low renewable, high demand periods of the day. This increased volatility in prices can only be exacerbated in a 5 minute market as reliance on flexible technology can be exploited by those units able to provide frequency response with little to no notice of deviation, thus once implemented energy users and retailers will be keen to balance any residual position in the pool or OTC before the price is set by AEMO.

It is unlikely that AEMO will look to reduce the reliance on these plants in the short term, as batteries and other fast cycle response units are not at a scale to accommodate the intermittency of these renewable energy sources or the ramp-up capabilities at the start and end of the day. To further exacerbate this, the intermittency of wind which will become a much larger factor in QLD now that Coopers Gap (453MW) and Mount Emerald (180MW) are operational, when not constrained, and with the MacIntyre windfarm (102MW) in development.

AEMO will not have missed the blackouts in the GB market after a lightning strike took out a gas station and offshore windfarm almost simultaneously in Q419, resulting in over 1.37GW being lost from the system, causing the frequency of the grid to drop to 48.8Hz and over 5% of Britain’s electricity supply being turned off for over 40 minutes. It is assumed AEMO will take this as an example of the importance of further increasing the reliance on those units which can run at Stable Export Limits and provide spinning reserve.

However, with European countries signing up to 100% renewable markets in the next 40 – 50 years the likelihood that Australia’s markets will follow seems to be a natural progression. However, with lack of government incentives to ensure future investment in these projects and the reduction in returns due to the cannibalisation of the prices, leads to the bigger question of, will investors still see this as a safe bet? Could the Coronavirus highlight the benefit of this fast cycle super peak industry and lead to policies which would allow this investment, to bridge the gap of the renewable projects which is already being encouraged?


Written by: Kate Turner (Senior Manager, Markets & Advisory)


For more articles, visit our news page: https://edgeutilities.com.au/news/

To keep up-to-date with Edge Utilities, connect with us on LinkedIn: https://www.linkedin.com/company/edge-utilities/

Back to the Future Part Two: Still a long way off

Back to the Future Part Two: still a long way off

In the 1989 film back to the future part 2, we were promised we would have hover boards and flying cars by 2015. Now I know we shouldn’t believe everything we see on TV, but I think a few people feel robbed of the future they were promised! The Tesla self-driving car and a Segway is about as close as we have got by 2020.

CSIRO’s Report

When CSIRO, Australia’s main scientific research body, stated the whole of Australia’s car fleet will be electric by 2050, there were doubts. Let’s dive deeper to see if there is merit in the claim.

CSIRO released 5 scenarios incorporating electric vehicles, rooftop solar and batteries which fed into the Australian Energy Market Operator’s (AEMO) Integrated System Plan (ISP). The ISP was released at the end of 2019, but the step change latest scenario has been the one to attract the most controversy. This is due to it showing what it believes can be possible from these technologies with the right grid integration and the rate of reductions in costs which could be possible for these technology with large scale uptake. It is also being overly ambitions not just limiting Australia’s contribution to warming at the agreed Paris agreements 2oc but exceeding this with an ambition to be closer to 1.5oc.

They do acknowledge with this there is significant increase in electricity demand but they do not address the cost of this, nor do they address the likely advertising campaign which would ensue if a mandatory “carbon tax on wheels” was introduced. Merely they expect a price parity of electric to petrol cars by 2025 and that charging would not be an issue.

I fear therefore that this scenario is another which is based on a chess board which is not in place. With no federal government really wanting to raise their head above this parapet, it therefore limited incentives to move to electric vehicle and investment in the electrification capabilities, i.e. charging. As such the likelihood of it coming to pass in this timescale is unlikely.

Arena (Australian Renewable Energy Agency)

However in contrast, Arena, the Australian Renewable Energy Agency, has agreed to fund a two year, $2.4m trial to create a vehicle-to-grid power source where electric vehicles can provide system security and be paid to plug their EVs into the grid. With this Australia join the ranks of around 50 other vehicles to grid projects (~50% of which are in Europe). This trial is using around 50 cars from the ACT governments new Nissan Leaf fleet and could provide grid stability without the huge outlay required for a Tesla battery or a Snowy 2.0 hydro project.

Initially, these discharges will only be used for Frequency Control Ancillary Services (FACS) to the National Electricity Market (NEM). This will allow AEMO to maintain the frequency of the system. But with discharge ability within tenth of a second Dr Sturmberg (Australia’s National Universities research leader in Battery Storage and Grid integration) anticipates that if this was available across Australia’s 19 million vehicle fleet “it would store more energy than five Snowy 2.0’s or over 10,000 Tesla Big Batteries.”

These vehicles will work on bi-directional chargers and it is anticipated with more people working at home these could later become an in-home battery also. If proven feasible, this vehicle-to-grid technology could be the biggest disruptor on the Distribution System since small scale solar PV was introduced. The ability for consumers to have the control and ability to support the grid in a controllable way and with returns expected to yield around $1,000/Year this extra revenue could this create a significant incentive to start the drive towards the electrification of Australia’s car fleet with or without government legislation.


Written by: Kate Turner (Senior Manager, Markets & Advisory)


For more articles from Edge Utilities, visit our news page: https://edgeutilities.com.au/news/

To connect with us, follow our page on LinkedIn: https://www.linkedin.com/company/edge-utilities/

An Introduction to the NEM

An Introduction to the National Electricity Market NEM

The utilities market is complex and always changing, and it’s crucial for businesses, Strata and Body Corporates to understand their energy, gas and hot water contracts. We have an in-depth understanding of the needs and regulations in the management of Strata and Body Corporate operations and finance. We are ready to share our knowledge with you in order to maximise value on your utilities spends.

It is important to understand part of the process that goes behind producing the energy that is consumed by your business, Strata or Body Corporate. The National Electricity Market (NEM) operates on one of the world’s longest interconnected power systems. The NEM travels a distance of approximately 5,000kms across East Australia, stretching from Port Douglas, Queensland through to Port Lincoln, South Australia and across the Bass Straight to Tasmania.

The NEM incorporates around 40,000kms of transmission lines and cables, and supplies approximately 200 terawatt hours of electricity to businesses and households each year.

When you switch on your computer at work, power is instantly transmitted from a power station to the appliance. We may think that this is an easy process, however there is a lot more to it.

To ensure that the electricity required is delivered to consumers, there is a specific sequence of events that needs to take place first.

Generators

Electricity is produced by the conversion of energy found in resources such as coal, natural gas, oil, solar and wind. Generators in modern power stations produce electricity by the mechanical action of large, powerful magnets, that spin rapidly inside the huge coils of conducting wire driven by steam, gas, water, and wind turbines.

Generator Transformers

Convert electricity that has been produced at a generating unit from low to high voltage (up to 500 kV). This process enables efficient transport of the electricity to the transmission network.

Transmission Lines

High voltage currents leave the generator transformer and travel along the transmission network. The transmission network acts as a bulk transporter of electricity through a series of high voltage power lines. These lines stretch great distances across the east of Australia.

Distribution Transformer

Receives high transmission voltage and reduces it to a lower voltage, that can soon be distributed to consumers. Once this process is complete, the electricity transfers over to the distribution network.

Distribution Lines

After leaving the transformer, electricity will travel along the distribution lines and into a distribution substation. Here, high distribution voltage is again reduced to a lower voltage. The new lower voltage electricity is now suitable to be distributed to local lines such as the power lines we see on our streets.

Consumption

Once the above sequence is complete, we can turn on our computer and get on with our day.


For more articles from Edge Utilities, visit our news page: https://edgeutilities.com.au/news/

To connect with us, follow our page on LinkedIn: https://www.linkedin.com/company/edge-utilities/