Coal and gas move to renewables and storage

renewables and battery storage

With Enel X announcing the installation of battery storage systems in shopping centres in Melbourne and on the NSW central coast, this year may see a shift in the energy market as we transition from coal and gas to renewables and storage.

AEMO has for many years been looking at a fundamental shift in generation, transmission and energy usage. AEMO is now focusing on firming electricity, electric vehicles and the regulatory framework to enable these changes to occur.

Key federal policies have underpinned the need to progress an increase in renewable energy. Growth in renewable energy is dependent on the growth of storage to be fully utilised and the need for greater transmission infrastructure is required to link the projects to the end users.

In recent years we regularly saw that the NEM had the potential to operate with very high levels of renewables, but the limiting factor still remained that thermal generation provided the firming, reliability and system security when the wind was not blowing or the sun is not shining. At the end of December, South Australia produced 104% of its demand with renewable energy and exported the extra electricity to the neighbouring region.

AEMO reports show there is currently 21GW of new projects undergoing connection assessment and they expect 5GW of new capacity to be added during FY2023 adding to the 4GW currently operating.

To assist this influx in renewable generation ARENA granted $176m in December 2022 to fast track 8 new battery projects bring in 2.0GW/4.2GWh of storage. The plan is to triple the battery storage across the NEM by 2025.

Over the next year we will also see more transmission lines connecting the nation as more renewable energy zones are connected to the load centres under the Rewiring the Nation policy. The first transmission projects to receive Rewiring the Nation funding were announced following the October 2022 Federal budget. Recently funded projects include the VNI NSW-Victoria interconnect, Marinus Link and various NSW transmission projects connecting the renewable energy zones. This funding will assist in building the transmission lines over the next 10 years.

If you would like a strategy to ensure your company procures energy to support sustainability and growth in renewables  please reach out to discuss your options.  To save on electricity spend, you can also join our Edge Utilities Power Portfolio, read more: https://edgeutilities.com.au/edge-utilities-power-portfolio/ or call us on: 1800 334 336 to discuss.  

Federal and State Government agree to power bill

Last Friday National Cabinet met and agreed on the states introducing a cap on wholesale gas and coal. The temporary cap will be set at $12/GJ for gas and $125/t on coal and will not be enforced on export contracts, therefore not limiting the opportunities for high international prices.

During the meeting it was agreed that the states would sort out the coal cap and the Federal Government would change laws to legislate the $12/GJ cap on domestic gas. As the caps are focused on the domestic market, they will only have a small impact on the profitability of producers. It is anticipated that only 4% of gas 10% of coal will be covered by the cap, the remaining volumes will be exposed to international markets. As the states have been tasked with implementing the cap it is likely they will go down different routes to achieve the same outcomes.

The simplest state to implement the changes will be Queensland as the government still owns and control 80% of the coal fired generation fleet. Queensland will likely use its direction powers and instruct its government owned corporations (GOCs) to dispatch the coal assets below specific prices, where NSW will likely use changes in law to cap the price.

As the cap mechanism will be used for uncontracted gas and coal, this may have limited impact on generators, as most of the coal and gas has already been produced under longer term contracts at a cost below the proposed caps. At this stage it is unlikely that the mechanism will be in place until February despite federal politicians being recalled to Canberra on Thursday to discuss the issue.

While the bill will get the support of the House of Representatives it is expected the Greens will put pressure on the government in the Senate to limit any compensation for the coal producers.

In line with the price caps, National Cabinet also discussed an assistance package to lower the impact on families and business as a result of high inflation and high commodity prices.

If you feel you need more control of your company’s energy spend, please reach out to discuss joining our Edge Utilities Power Portfolio (EUPP) where we use the power of bulk purchasing to help Australian businesses of all sizes save on their energy bills. Read more: https://edgeutilities.com.au/edge-utilities-power-portfolio/ or call us on: 1800 334 336 to discuss.  

Why growth is slow in renewable energy

The Clean Energy Council (CEC) recently released to its members the quarterly renewable projects report, which showed only one renewable project, Stubbo solar farm, reached financial close in Q3 – 2022. Investment in renewables is at an all-time low where quarterly investment has dropped almost 60% to $418M. As well as project growth which has slowed by almost 30%, compared to Q2 -2022 and over 60% lower than Q3- 2021.

While politicians are talking up the prospects of a renewable energy driven industry to reduce the impact of climate change, the reality is, reaching the 44GW target outlined by the federal government may be hard to achieve at the current rate of growth.

A significant number of new wind, solar and storage projects need to come online. If these projects do not come online the retiring coal generators cannot be replaced and may be forced to remain in action.

While only one renewable project in Australia reached financial close last quarter, two projects completed commissioning and three new projects started construction during Q3- 2022. Currently there are 247 financially committed renewable projects in Australia, with 221 under construction and 169 undergoing commissioning.

The CEC notes that the desire to build new solar, wind, pumped hydro and transmission lines is meeting opposition from by local communities. Some examples being, Chalumbin wind farm in North Queensland is now reducing the number of planned wind turbines it is installing by half,due to the concerns from the local community. There are also concerns for the largest pump storage hydro project that the Queensland Government is planning to construct near Mackay, after locals have discovered the mega project has the potential to flood a local town.

With ambitious renewable targets being spruced by politicians and businesses actively seeking renewable energy to aid in the decarbonisation of their operations, the question of where and when these projects will be delivered need to be asked. The majority of people support the transition to renewables but obviously not in their own backyard.

Overview of the National Electricity Market (NEM) – Quarter 3, 2022

The NEM has experienced an unprecedented year of high electricity spot prices, recently Q322 averaged $216/MWh across the (NEM) which was more than three times higher than the same quarter in the previous year and close to matching the all-time high during Q222 of $264/MWh.

Many factors influenced the volatility and elevated spot prices including:

  • A tight supply / demand balance resulting from gas flow restrictions in Europe associated with the war in Ukraine
  • Australian weather events
  • An increase in demand
  • Generator bidding behaviours
  • A reliance on thermal generation (coal and gas fired)

Coal and gas prices are at all-time highs due to international demand leading to a high cost of generation. In turn increasing the underlying fuel cost for generators, contributing to the increase in spot prices. As little energy storage is currently installed in Australia, large swings in the output from wind also contributed to the volatility in the market.

Generators who want to sell electricity to the NEM must submit a bid detailing how much energy they would like to offer in ten different price bands. Recently a lower volume of generation has been available from coal due to bidding behaviour with participants withdrawing thermal capacity and intermittent generation like solar and wind taking a larger market share.

A lower capacity factor for coal generation has resulted in coal fired availability to move higher up the bid stack, resulting in coal fired generation needing to dispatch at higher spot prices to meet their long run average costs.

Weather influences such as La Niña and a negative Indian Ocean Dipole (IOD) event increased the likelihood of rainfall across the east coast of Australia this year. With September’s rainfall being the fifth highest on record across Australia. The cloudy and wet conditions impacted solar generation and the supply of coal to power stations resulting in higher fuel prices.

Demand from the grid has increased for the first time in Q322 since 2015 as households and businesses require more electricity from the grid due to rooftop solar not generating as much as previous years due to cloudy conditions.

If you feel you need more control of your company’s energy spend, please reach out to discuss joining our Edge Utilities Power Portfolio (EUPP) where we use the power of bulk purchasing to help Australian businesses of all sizes save on their energy bills. Read more: https://edgeutilities.com.au/edge-utilities-power-portfolio/ or call us on: 1800 334 336 to discuss.  

The state of the market – rising energy costs in today’s budget explained.

Up and up

The budget handed down last night by the Albanese government really did show that there will be “hard days to come”. The treasurer, although acknowledging the international pressures and increases of electricity prices, did nothing to assist with this increasing cost on households and businesses bottom lines.

So why are international pressures a driver for the electricity we use when we turn on our lights?

Well let’s start with a breakdown of what goes into our bill, a large customer will see this split into each section, but smaller businesses and households don’t, they are just rolled into a flat tariff.

There are 4 main components of the energy we buy:

  1. The physical electrons / energy we purchase
  2. The environmental subsidies we all contribute into for a certain number of renewables to be underpinned
  3. The cost of running our electricity grid
  4. The cost of maintaining and running the infrastructure from the huge transmission lines coming across the state to the smaller distribution lines which bring the power to our business or home

The cost of the physical power we use has been on a rollercoaster the last few years. From unprecedented lows during the pandemic, when there was little global demand for our exports and lower demand from our domestic industry to the highs we are now experiencing. But to breakdown this huge shift we have to look abroad.

Let’s first address why we are looking outside of Australia. As a country our coal and gas is largely exported into Southern Asia. Their thirst for energy has increased dramatically over the last few decades and our abundance of natural resources and location made us a great partner to feed their demand. But we are not the only ones satisfying their thirst for energy, and therefore our price of export at is linked to the price other global countries will export at. Setting the ’Global price’. It is just like us going into Coles (China) and seeing Tim Tams for $20 and knowing they are $4 in Woollies (Australia), we would always shop at Woollies. Therefore, to ensure no company misses out the price is always about the same no matter where you shop.

So, if you are an exporter of coal and you know you can sell your Tim Tams to Coles for $20, why would you supply our domestic market (Woollies) at $4/pack. You wouldn’t, you would pile all the coal (Tim Tams) you could on a ship and send it away as quick as you can, and that is why we are linked to the international market. As we need the Tim Tams (or Coal) to ensure our domestic electricity demand is met. But, to do this, we also have to pay the $20/packet to make sure we can have enough here in Australia.

This international price has skyrocketed recently. Not only has demand come back from all the lockdowns caused by COVID19, but the Ukraine crisis has thrown global energy into a tailspin. Europe, who used to be nicely fed their Oil and Gas from Russia now cannot get their supply, as such they are telling everyone they will buy the Tim Tams for $25 even $30 per packet. So again, the circle of, if I can sell to them for $30 why would I sell to Woollies for the now $20 price re starts until Woollies (Australia) is now paying $30 per packet.

But as the cost of the Tim Tams go up we start thinking maybe I will have a Kingston (Gas) instead, it is easier to buy and no one has bought them all for the next 18 months at $30/pack. So, as we all start leaving behind the expensive Coal (Tim Tams) because they have all being bought and pre-ordered for 18 months and move to Gas (Kingston’s). In doing this, that price also increases, and so the spiral re-starts.

Now let’s add some spice. The delivery truck bringing those Tim Tams and Kingston’s to the shops (Power Stations) are flooded in, or the truck unloads but they all get soggy in the rain. Now they can’t be eaten (burned to make electricity). So, what happens? What was already a high price, gets higher. So, with a third La Nina forecast for Australia and flooding already affecting many regions, these deliveries are either delayed or just don’t make it. Meaning an already tight market becomes more sparce and therefore more expensive.

Now the cynical among us would say that the generators are taking advantage of this, and the market is pushing the price higher and higher because they have bought their Kingston’s and Tim Tams at $20/packet and could sell them to us at that price, but instead they know they could now charge $30 per packet so why not, they bank the $10 per packet and no one is wiser. But that is for the ACCC, and you would hope they are watching such behaviour with eagle eyes!

These are a handful of the drivers affecting our price at the moment, there are currently 7 to 10 of them all similar in their affect, that any fluctuation anywhere in the world is having huge repercussions to us at home.

But they aren’t the only changes. With huge pushes towards renewable energy and the certificates produced by them, this market is also increasing as the number of renewables is not increasing as quickly as the amount required. Therefore, again the costs go up and this is passed onto the end users in their bills. Now factor in this renewable energy is going to cost more not just now but in the future, as the cost of making the solar panels increases as the electricity price increases. Therefore, the cost of any of this de-carbonisation has just increased in price too.

But that isn’t the end of the story, finally, let’s consider the cost of bringing the power from the power station to our meter. This is a huge amount of infrastructure which is either older requiring it to be maintained or new requiring funding. Both costs are underpinned by debt. The higher the lending rate is, the higher this debt becomes and therefore the more we are charged to use their system. Further with the huge roll out in renewables this will require significant upgrades to the system as the power will be coming from less conventional areas to the load centres (think towns / cities). With the interest rates rising the cost of this debt or borrowing goes up, just like a mortgage on a house. Again, this only means one thing. An increase in pass through costs to our bills. With huge renewable ambitions and nowhere near enough funding passed down in this budget, that can only result in increases to our bills from our retailers.

Unfortunately, this means that without significant easing of many of these fundamentals, there is no relief in sight. Maybe for once the sensational headline of 35% increases in bills may turn out to hold some truth.

Edge Utilities can help:

If you feel you need to take more control of your company’s business energy spend, please reach out to discuss joining our Edge Utilities Power Portfolio (EUPP) where we use the power of bulk purchasing to help Australian businesses of all sizes save on their energy bills. Read more: https://edgeutilities.com.au/edge-utilities-power-portfolio/ or call us on: 1800 334 336 to discuss.  


Mojo and the market squeeze

Australia it seems is not immune to the Retailer of Last Resort (ROLR) process which has been plaguing the European energy market for the last few years. Germany is discussing bailouts for Uniper SE, the French Government is talking about fully nationalising Électricité de France SA. The UK has seen over 30 electricity providers go into Retailer of Last Resort in the past few years, a gas shipper backed by Glencore go under, and have put Bulb Energy under the government’s control.

The Australian market isn’t immune either with Mojo just the latest retailer to enact the Retailer of Last Resort mechanism for its 500 customers.

So, why are so many companies buckling under the current energy crisis and what can you do to avoid being wrapped up in the process?

The squeeze of the energy markets is due to many factors, including the war in Ukraine and sanctions on Russian Oil and Gas reducing availability, catastrophic flooding affecting the mines and rail tracks from our own domestic coal supply and in our opinion some generators ensuring they are well placed to benefit from any perceived shortness of supply. All these factors have pushed the price of our domestic electricity and gas to unprecedented levels, and we are not the only ones. With Europe at 6 to 8 times higher than the last 5 years average there is no easing of international fundamentals pressure.

This should lead to higher prices on our bills, however, if a retailer has not adequately protected their position and are exposed to these prices, they cannot simply pass them through to the end user. Some consumers are protected by the Default Market Offer, this is the maximum that you can be charged on your bill, and it applies to mums and dads and small businesses with solar installed.

That isn’t a problem, is it? Well, if these retailers have not ‘hedged’ or bought the electricity contracts for their customers, before prices went up 6 to 8-fold, and they cannot pass through these higher charges, then they are no longer in a viable position to continue as a business and must call in a Retailer of Last Resort to take their customers and close. The customers who are passed to a new retailer then risk being passed through on a more expensive tariffs or variable tariffs.

With increasing interest rates globally eating into all aspects of businesses profitability and further possible energy price spikes, as retailers look to pass through as much of their costs as they can, we do not believe Mojo will be the last to shut its doors.

So how can you protect yourself from being exposed to variable pricing or smaller retailers in this market? Well, there are several ways:

  • Ensure you have a reputable retailer, the EUPP only works with the top tier retailers who have sound strategies to hedge their longer-term positions, either through generation or trades.
  • We ensure that all costs are either agreed at the start of the contract or passed through with no uplifts, and the allocation of these pass-through costs is fair.
  • Finally, the EUPP puts you into a larger group of buyers of electricity, allowing your company to benefit from access to retailers and contracts usually only available to the larger market.

All this coupled with the expertise of the energy managers, who manage your energy portfolio to ensure it keeps up with the market and defend your portfolio in this volatility.

If you feel you need more control of your company’s energy spend, please reach out to discuss joining our Edge Utilities Power Portfolio (EUPP) where we use the power of bulk purchasing to help Australian businesses of all sizes save on their energy bills. Read more: https://edgeutilities.com.au/edge-utilities-power-portfolio/ or call us on: 1800 334 336 to discuss.  

Is unaccounted for energy (UFE) allocation affecting my company’s bottom line?

Energy meter costs

I find myself asking, is UFE the UIG of Australia? Anyone who knew me in my past life in the UK knows that I harped on about Unidentified Gas (UIG) A LOT!

The idea behind the UK’s UIG is simple, it is to allocate the gas which couldn’t be attributed to a meter in an area, across all end users in that area in which it was used (known as “off-taken”). Seems simple right. But when was the last time you actually gave a meter reading? Possibly six months to a year ago, right? Well that means your off-take (unless you are on a smart meter) is estimated and you will be either over or under on allocated unidentified gas.

Now although this seems sensible with everyone eventually giving a meter read and therefore it will all work out in the wash,  the issue is currently exacerbated by the extreme increase in the gas price. These high prices are now passed through to retailers and then in turn our bills.

Now what does understating this UK gas usage or allocation have to do with Australia? Well, quite a lot. The system is similar, but not the same.

Following Global Settlements being introduced by AEMO we have started seeing Australia’s version of these charges coming into our bills. We allocate the unidentified – called Unaccounted for Energy (UFE) within each region by the off-takers in that area.

What we are not doing yet, which in the UK’s defense they do there (through XOServe), is take into account those meters which are half hourly ready (smart(er) meters) and therefore their usage should be known. Currently in Australia, the offtake in a region will be directly linked to your proportion of energy being allocated to you and you literally have no say in these charges, despite having updated metering capability.

The sore point of it all is, that this is occurring at a time where our electricity market is extremely high and therefore there is a possibility of the combination of large UFEs at high prices being passed through to end users, whilst having no control over the volume or price it is passed through at. This is leading to significant shocks to companies’ outgoings, as there is little to no visibility on the charge on any given month, and no way to forecast them for a company’s budget.

I fear that UFE will become my new soap box issue, but I can guarantee this isn’t the last anyone will hear on this. I am pretty sure I won’t be the only one who will be making noise.

Is this happening to you? If you feel you need more control of your company’s energy spend, please reach out to discuss joining our Edge Utilities Power Portfolio (EUPP) where we use the power of bulk purchasing to help Australian businesses of all sizes save on their energy bills. Read more: https://edgeutilities.com.au/edge-utilities-power-portfolio/ or call us on: 1800 334 336 to discuss.  

 

Let’s talk Energy Markets


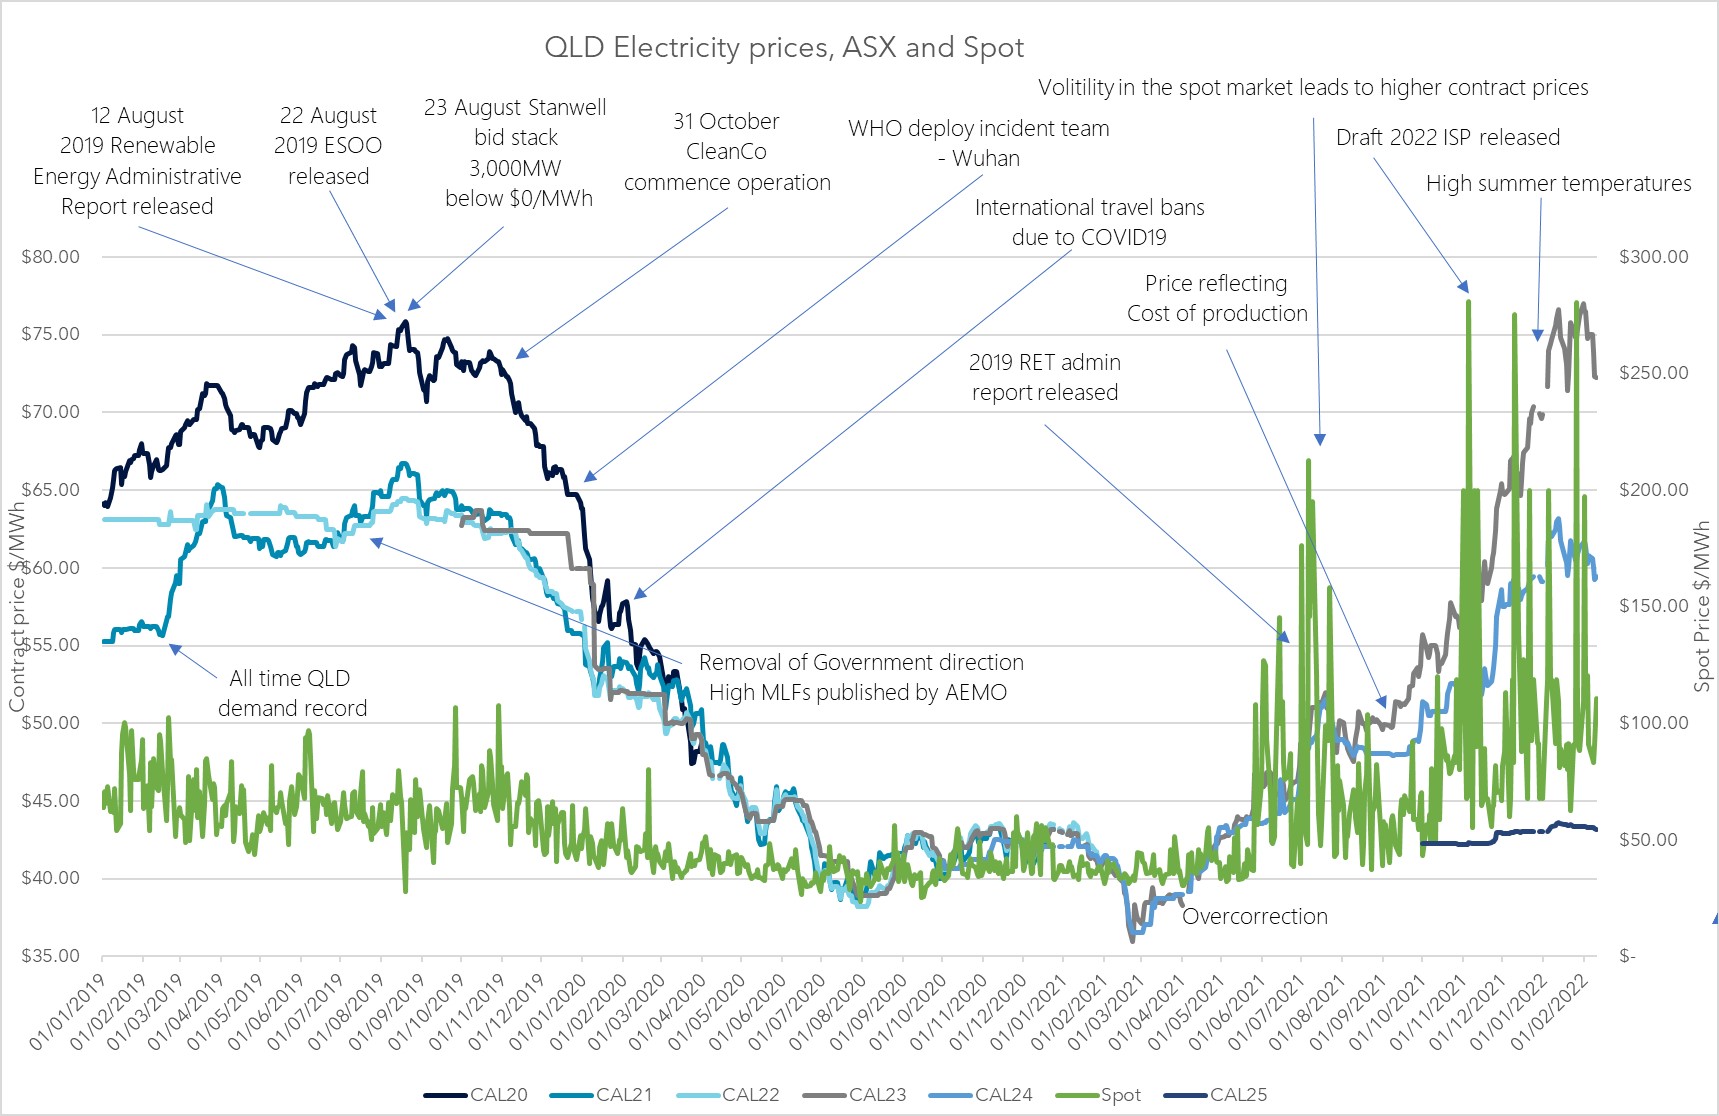
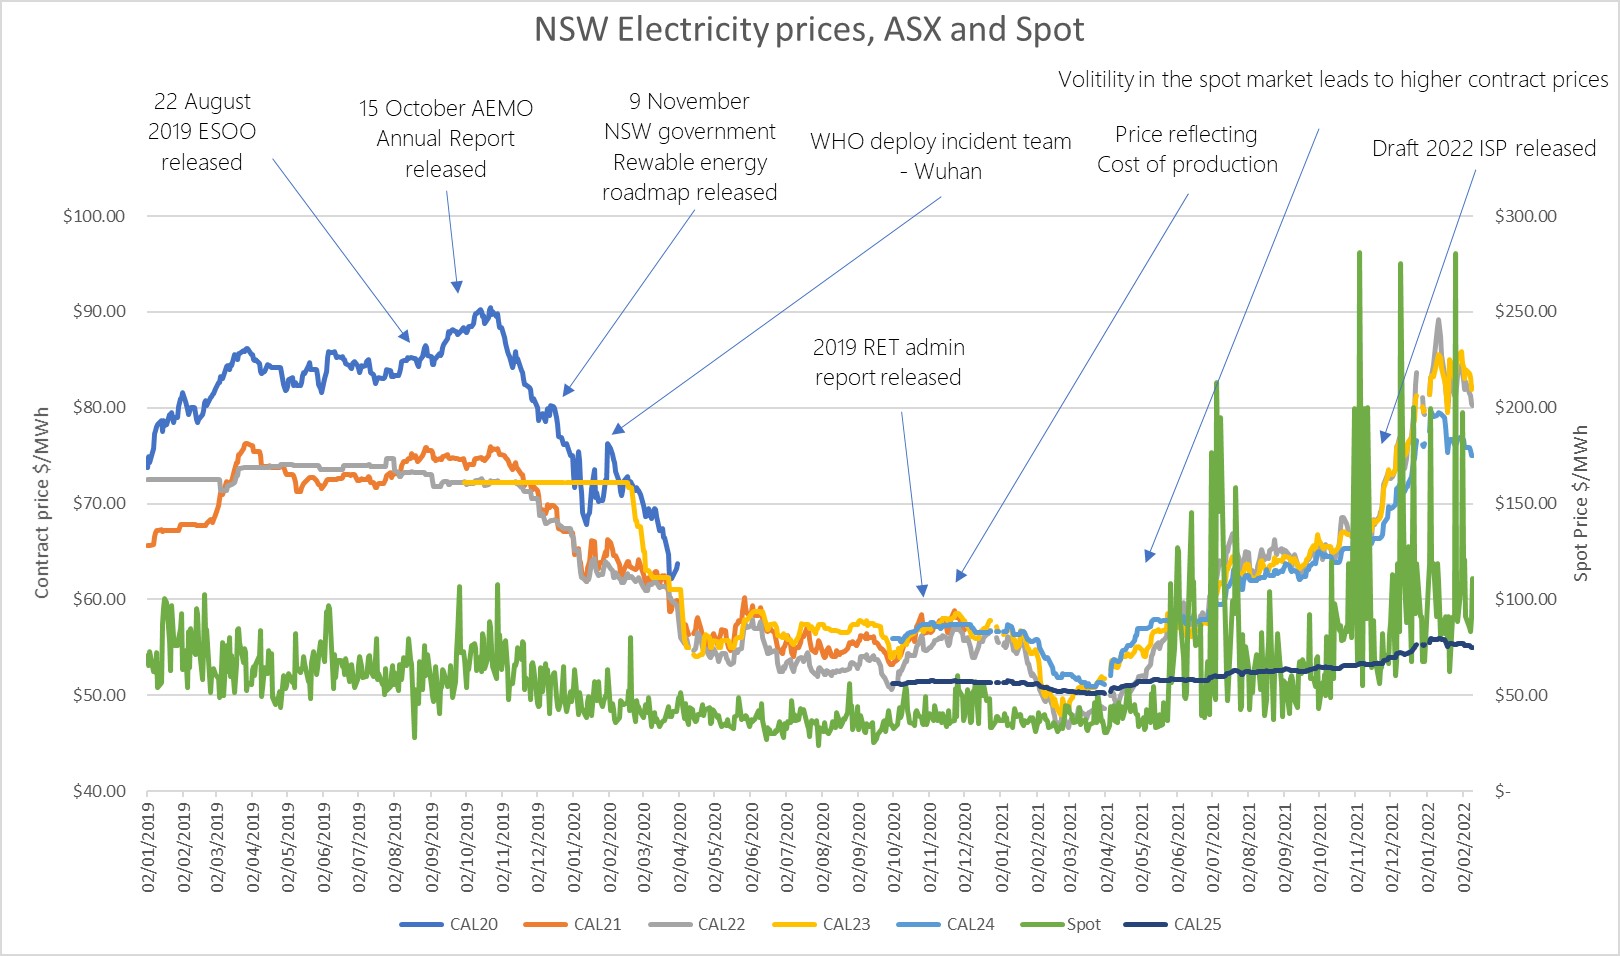
In the past 2 years, the market has dropped from highs of over $75/MWh in August 2019 then following the events outlined on the chart below the market price dropped to historic lows of around $36/MWh. Following some volatility at the start of 2021 driven by a hot summer, the market firmed and increased further because of the catastrophic failure of Callide C4 and the tripping of many other power stations.

The chart below shows that the underlying spot price (light blue line) has continued to spike and trend up resulting in increases in the contract prices. Another interesting aspect of price curves is how market announcements such as the cost of coal and gas can impact the curve. In months, the curve softened but spiked due to conflicts in Ukraine causing coal and gas, a key input to thermal generation, to increase in price.

The spot price of these commodities is not directly linked to the fuel price used by generators in the next quarter, so the market has now softened.

Future years are also becoming cheaper year on year as renewable energy takes a larger share of the market and renewable energy is expected to continue to fall in price.

Having recently undertaken a few requests for proposals (RFP) for our clients, we are aware there is good value for companies willing to take up longer term renewable PPAs. More and more projects are becoming available post 2023/24.

Undertaking a renewable PPA will go towards meeting many companies’ sustainability targets through the procurement of renewable energy and environmental certificates.

Below are the contact details for Alex. He would be happy to discuss your company’s sustainability targets and how we can help the business reach them.

Alex Driscoll

Senior Manager Markets, Trading & Advisory

M: 0437 966 409

P: (07) 3905 9226

T: 1800 334 336

E: alex.driscoll@edge2020.com.au

SOLAR LEADING THE WAY

Each week new records are broken across the energy market. Be it historic record low demands, reducing levels of thermal plant availability or the increased availability from renewables.

Last week saw solar reach more than 50% of Australia’s demand. This came as record generation levels came from both rooftop PV and large-scale solar sectors.

Ironically this record occurred on Sunday while the National Party room was meeting to discuss their stance on net zero emissions. As the Nationals push to lift the profile of the coal industry and power the country from coal fired power stations, solar generation reached 51.8% of the NEMs demand.

While regions like South Australia have passed the 50% solar milestone during the weekend it was the first time the NEM reached more than 50%. As expected, solar provided most of the electricity between 11:00 and 13:00, peaking at 11:55.

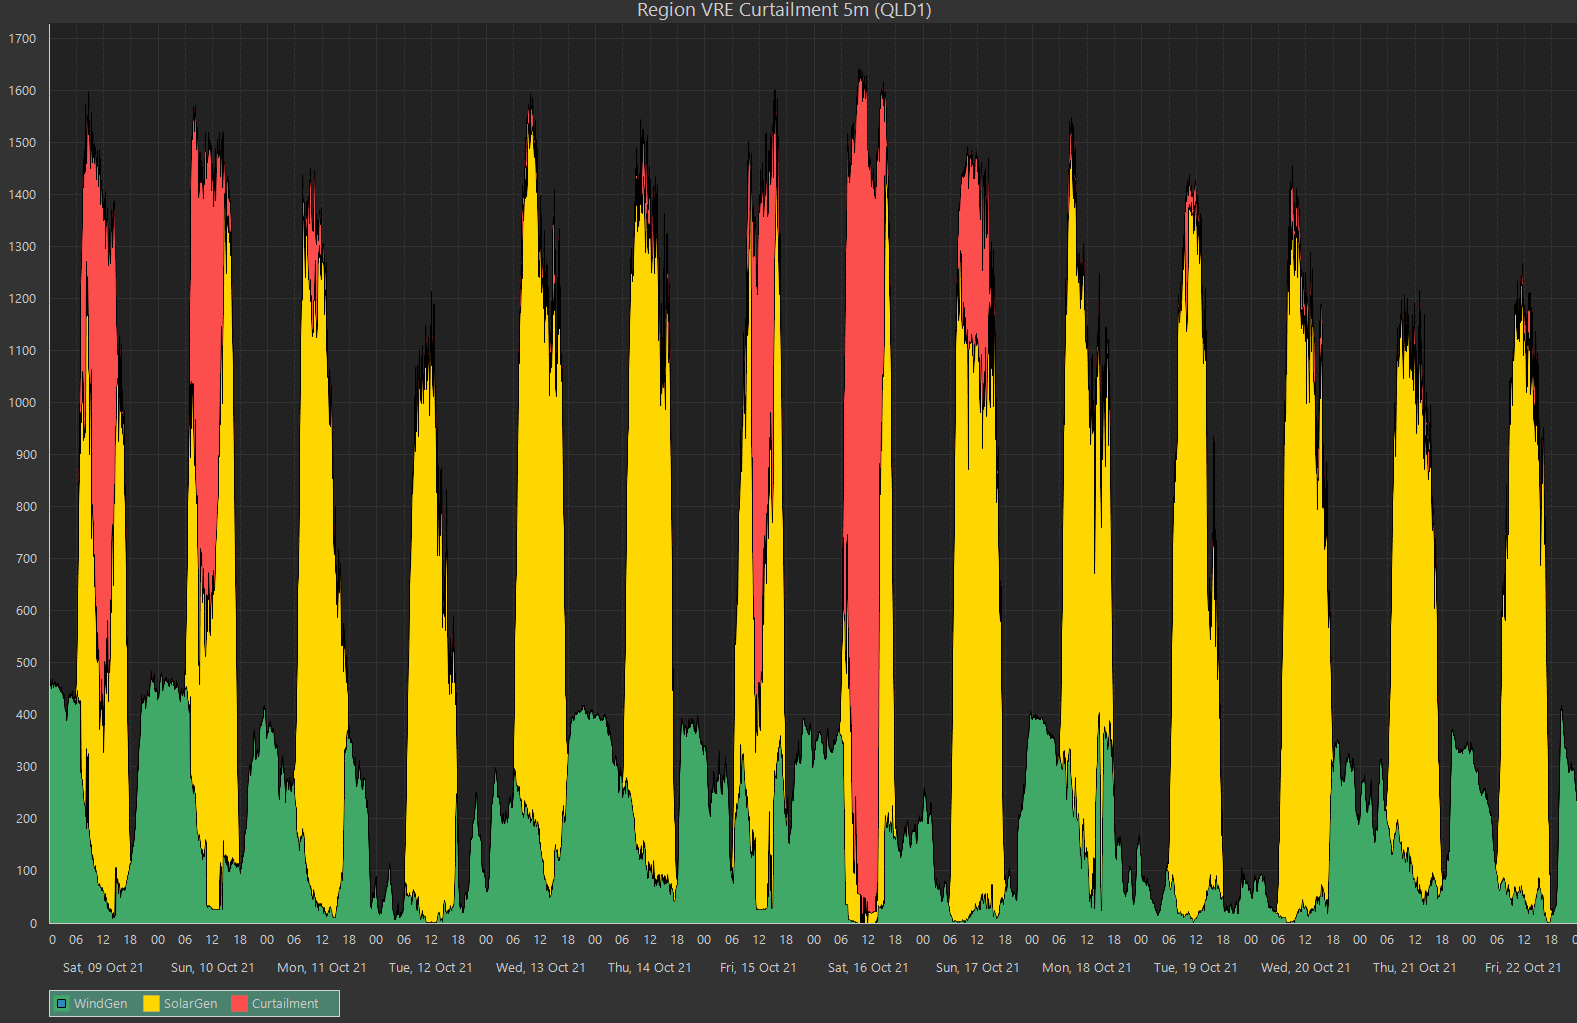
The 50% hurdle could have been higher as negative prices in South Australia economically constrained some large-scale solar plants. On the previous day, the record would have been broken if not for Queensland economically constraining off 1,800MW of large scale solar due to negative prices.

As mentioned above the NEM is also experiencing low operational demands and in line with the high rooftop PV generation, the demand dropped to a record low across the NEM of 12,936MW on Sunday as solar reached over 50% generation. As rooftop PV is not economically constrained, it accounted for 38% of the underlying demand.

As solar generation increased, it displaced coal fired generation with black coal generation throughout Queensland and NSW reaching historic lows of 6,105MW.

These statistics were surely discussed in the Nationals party room over the weekend and along with AEMOs forecasts showing the NEM can reach 100% renewables by 2025 as their base case scenario in modelling such as the ISP and the ESOO, the question about the role of renewable and coal in the market must have been discussed.

During the Spring months, skies are clearer and air temperatures are conducive to low air conditioning and heating loads, we could realistically see a situation where rooftop PV could cover demand. Of course, this will cause issues for AEMO who are required to keep various synchronous units online for system security however recent changes have allowed AEMO to employ systems to switch off solar in the event of a grid event to maintain grid security.

Written by Alex Driscoll Senior Manager Markets, Trading & Advisory

Summer Weather Outlook

The Australian Bureau of Meteorology (BOM) has officially put La Nina on a watch status for the second year running. This means there is around a 50% chance (double the normal chance) of the phenomenon re-forming in 2021.

This is seconded by the US National Oceanic and Atmospheric Administration (NOAA) climate prediction centre forecasting a 70% chance of La Nina forming for the second consecutive year.

The Summer and Autumn of 2020 – 2021 were the wettest and coolest experienced in Australia for the past 5 years, and this was driven by the La Nina effect. Although not as extreme as the 2011 La Nina event, which was one of the strongest la Nina’s seen on record, we would expect that if it does form again this year it would most likely follow last year’s pattern.

There are other drivers looking to encourage a wet summer as well.

The lesser known Indian Ocean Dipole (IOD) is the temperature difference between the Eastern and Western Indian oceans. A positive phase of the IOD would lead to less rainfall and a negative IOD leads to more rainfall in the South and East of Australia throughout Spring.

In 1974 a negative IOD occurred with a strong La Nina and Australia recorded the wettest year on record. Although the two can coincide it is a complicated relationship and a significant area of research within the Climate community.

This year the latest BOM outlook has 3 of the 5 international climate models moving the IOD negative from October. Although not sustained into 2022 and a weaker index than some previous years, a negative IOD would still be expected to increase the chance of a wet Spring. The weakening of the index into the Summer is a standard trajectory for the IOD.

On the other side of the continent, the Southern Annular Mode (SAM) (related to the Antarctic Oscillation (AAO)) is showing a slight positive indicator. This correlates with a strengthening La Nina index as the two tend to be more correlated than other indices. A positive SAM will lead to more rainfall in the East and reduces the chance of a hot Spring and Summer.  Although as per the La Nina index these are not strong signals and could therefore change going into the later Summer and are mainly Spring indicators at the moment.

A final influence could come from the Madden-Julian Oscillation; however, these can only reliably be forecasted 14 days in advance as they pass around the planet every 30 to 60 days. If one forms you can expect North-Eastern Australia to experience significant rainfall as the system passed into the Pacific. They can bring monsoons and tropical Cyclones if occurring in the Spring and Summer and if this forms at a period of heavy rainfall we can expect it will significantly increase the flooding risks from the ground which is already saturated.

So, what does that do to our Summer? Well for us on the Eastern Coast it means don’t put away the gumboots and rain mac just yet. It is likely to be a rather wet Spring and depending on the development of some systems it could go all the way through our Summer. It also means we can expect the Spring to have cooler days across Eastern and Southern Australia and increased cloud cover leading to milder evenings.

From a generation point of view, increased cloud cover could lead to reduced Solar capacity for both large scale and roof-top systems and this will likely be coupled with below average winds in the Southern NEM.  There is a winner though, the Hydro plants in NSW and Victoria will be happy campers, if not a little sodden, with a higher than average rainfall expected in those catchments this Spring.

Article Written by Kate Turner Senior Manager Markets, Analytics & Sustainability