Are talks of AGL breaking up, just the start?

Is this the first move for major changes in the energy industry?

We have discussed the impact a changing energy industry is having on the Queensland Government owned energy companies and the impact on AGL. Generation, transmission, and retail companies are producing lower profits and their assets are being written down in value due to the subdued electricity prices going forward.

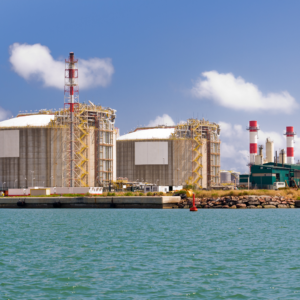
AGL Energy has been the first company to raise the option of breaking itself up as it positions itself to operate in a landscape of low electricity prices. Driven by the State and Federal Governments underwriting new clean generation, resulting in the high penetration of renewable energy in the National Energy Market (NEM). With this also comes a shift toward a decarbonised generation fleet to meet customers’ requests for low carbon and renewable energy.

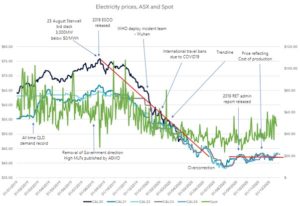
With profits dropping 27%, AGL has cut its spending and costs after a first half loss of $2.29 billion. AGL have also revisited their future expectation and now they predict that prices will remain low into the future because of the increase in renewable generation in the market.

A Gentalier is a company that is vertically integrated from its generation through to retail.

The key reasoning for breaking up AGL and other similar businesses is that they operate as a Gentailer. This model has been very successful for many years with the Gentailer generating cheap power from coal fired power stations and selling to its retail customers at a premium price. With the change to the generation mix various parts of the Gentailers have opposing drivers. Companies like AGL and the Queensland Government owned generators have large fleets of coal fired generation and relatively small amounts of renewable generation. But, the customers want to source their power from renewables.

Overseas energy companies have responded to the opposing challenges and have split their businesses between customer focused solutions, large scale renewable generation and the carbon intense coal and gas fired generation fleet. The carbon intensive parts of their businesses have been generally separated from the core business to allow the carbon intensive assets to be retired over time.

Breaking up their business into the retail company and the generation company is another option like the structure across Australia before vertical integration.

A third option is to create two retail front ends.

  • One backed by clean energy and
  • One backed by carbon intense energy.

Depending on the price point, the clean energy retail would flourish and the carbon intense business would diminish. While all this talk of different business structures is circulating it is likely that future retail solutions will also include other products like telecommunications and internet. All provided as the one package with electricity from one retailer.

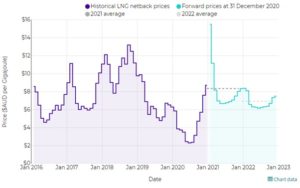
In another signal to the changing landscape, AGL have identified $150 million of operating cost savings to deliver in 2021-22, with $100 million reduction of stay in business capital expenditure between now and 2023. An increased growth budget to focus on battery investments and the Crib Point LNG import terminal in Victoria. The cost of LNG and investment in new gas fired generation is also on hold as AGL investigates the details of New South Wales Government’s energy infrastructure road map.

Why should you consider going green?

“Going green” has so many benefits – not just your local area but for the whole planet. Having green credentials is also great for your corporate social responsibility and is something you can brag about on your website.

Switch to green energy with Edge Utilities. Currently, Australia produces around 23.5% and 33 terawatt-hours (TWh) of its electricity from renewables. We still have a long way to go to achieve the Australian governments commitment of greater than 40% by 2030. We are now producing more green energy than ever before and the percentage of people who are in favour of using renewable energy in the Australia is rising.

Green Business Energy

Here in Australia, the government has set an ambitious target to reduce greenhouse gas emissions to 26-28% by 2030. It’s a pretty big ask, but by making significant changes, individuals and businesses can all play their part in making it happen.

Businesses use far more energy than individual households. Just imagine what could happen if your business joined thousands or even millions of others worldwide in switching to renewably sourced energy? Combined with improvements to energy efficiency, we can make a big difference.

What is Renewable Business Energy?

Renewable energy does just what it says on the packet. Unlike fossil fuels, these are energy supplies that won’t run out because they are renewable. Better still, this kind of energy production doesn’t harm the environment.

But where does renewable power come from, and how is it created? Well, it includes energy sources derived from solar panels, wind turbines, hydropower and biomass energy, such as plant or animal material used as fuel to produce electricity or heat.

Individuals and organisations can also generate their own green energy, using feed-in tariff incentives to make money by selling power back to the grid. These tariffs are based on the electricity generated by a renewable energy system which is used in the property, such as solar.

Some of the best solar feed-in tariffs in Queensland are as high as 18 cents per kilowatt hour (kWh) to eligible customers. The next best FiT rate comes at 17c/kWh and15c/kWh apiece.

This is usually paid by electricity grid, system or market operators and often known as a Power Purchasing Agreement (PPA).

Do you know what makes up the largest portion of your utility bill?

Electricity derived from the use of fossil fuels, such as coal, petroleum, and natural gas. These are non-renewable sources of energy. Once they are gone, they are gone – and the earth only has a limited supply. There are various estimates as to when we will have used up all supplies of fossil fuels, but many agree around the year 2060 isn’t too far off the mark.

We have a limited amount of time to make the switch to 100% renewable electricity.

Low or no-carbon electricity can be generated by solar or wind power, or by biomass. Biomass is used in Australia mainly for low-cost heating, especially in households without access to natural gas for heating. Currently we have more than 65 sites using landfill gas to generate electricity and a further 50 that operate away from landfill dumps.

Edge Utilities can help you to seek out the best green electricity tariffs for your needs, at exclusive prices you won’t find anywhere else.

T: 1800 334 336 E: save@edgeutilities.com.au 

Are batteries the solution?

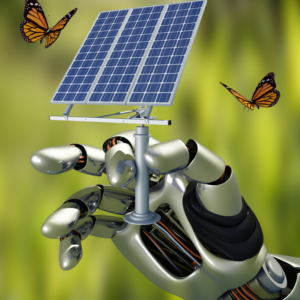
Over the last couple of years solar was the hot topic when discussing projects. Now battery storage is what everyone is talking about. From large scale projects, to smaller scale installations on the roof of households, commercial businesses, such as factories and now solar shaded car parks! Batteries are the new option everyone wants.

But………………………………… the question is why?

Because the easiest form of renewable generation to install is solar and as solar produces electricity in the parts of the day when prices are at their lowest, there is limited commercial value to the system owners.

In some cases when prices are zero and sometimes negative during the solar hour the end user is better off by taking power off the grid and not using the power generated by the solar.

For commercial sized installations, the operator sells the output over a longer term to payback the cost of development and construction but, margins are getting tight. There is a need to take advantage of the part of the day when prices are higher, to improve the financial viability of the projects. The solution to this is to time shift the solar generation into the times when solar is not available and prices are higher. This is done by storing the solar energy in the battery and discharging in those hours on either side of the solar shape. This is usually when most people are coming home from work.

In small scale projects, such as a household rooftop set up, a 5-kilowatt (kW) system will generate about 12 kilowatt/hour(kWh) per day. This accounts for losses due to site orientation, tree coverage and electrical losses. In some regions the generation output may be higher.

Home batteries are normally sized to approximately 10kWh per day, taking into account that most households with solar installations typically have a net consumption of 5kWh/day. Combine this with consumption and solar generation, which could take up to 3 days to full charge the battery. This would result in households paying for the solar and battery setup, along with paying to import electricity from the grid for their consumption.

There are two key areas to explore regarding battery storage.

1. If batteries become more popular the cost of each battery comes down and makes the commercial decision to install batteries easier.

2. Installation of a control system that can manage the solar / battery operation and optimise the system to the benefit of the end user. (we believe this is the more important decision)

With the installation of 45 gigawatt (GW) of batteries expected in Australia by 2025, there will either be a lot of wasted capital or a great resource to manage the intermittent generation and consumption across the NEM. However, with financial returns underpinning the investment of projects there will be skewing towards technology for the answer.

A serious solution to the dilemma of individuals desiring renewable generation to power their homes or businesses, extracting the value from the renewable energy across the day when the renewable resource may not be generating, and the economies of scale required to make battery storage viable, is the sharing of the renewable resource and storage capabilities across multiple households.

Edge has strategic partnerships in place to provide customised solutions to allow end users to receive the benefits of renewable generation and the use of battery storage.

We are using cutting edge technology to maximise the efficient use of the renewable energy and reduce the cost to end users.

We are installing Electric Vehicle (EV) charging stations into some of our Strata/Body Corporate schemes, to maximise the use of renewable energy produced during the day from onsite generation. This allows tenants to charge their vehicles overnight rather than charging from the grid.

Contact us to find out how we can provide the solutions to help you save money and the planet.

1800 334 336 OR EMAIL save@edgeutilities.com.au

Worrying Numbers for Generator and Transmission Companies

Last week the Queensland Audit Office (QAO) published a report on the performance of its Energy entities. The report summarises the financial and risk results of the government owned Generators, Transmission and Distribution businesses and its Retailers.

The audit report focused on a few areas including:

  • the strength of each entities IT security
  • the financial performance
  • the profitability from the sector and it’s continuing decline.

It is noted as a whole, the sector still returns a profit, be it at lower levels, to the government shareholders. Some parts of the sector i.e. Generators and transmission are not performing very well.

The report also acknowledges that the energy sector is undergoing significant changes and there is a need for the system to adapt to continue to supply affordable and reliable energy.

At a high level, profits across the six entities are down 88% to only $204M. Returns to the government shareholders were down 54% to $1B however, $1.5B was returned to customers, an increase of 37% on the previous year.

Over the last 4 years the return from the transmission, distribution and retail entities have been dropping at a steady rate while generation was returning $600M – $800M profit to the shareholders.

2019-20 has seen a rapid drop in profits from the generator sector. In Queensland, the State Government controls 68% of the generation assets and as a result have been exposed to the low spot and contract prices in recent years. This has resulted in a net loss of $367M for the generators.

Low Electricity prices have also impacted the value of the Government assets with over $1B being written down across the Power Stations.

The largest write down was Stanwell at $720M or 19% of their assets followed by CS Energy writing down $353M in value and CleanCo writing down $35M which includes the relatively modern Swanbank E Gas fired combined cycle generator that now was zero value. Swanbank E has an effective life until 2036 so in reality CleanCo expects net losses from operating this asset.

With the Queensland Governments exposure to such a large coal fired generator fleet, the shift to renewables and the retirement of its coal assets are a key issue for the government over the next 26 years of planned coal retirements. The QAO plans to report to the government on how the energy entities are managing the transmission from coal to renewable energy.

As we eagerly await the government’s plan to transition to more renewable energy in the generation mix, the question needs to be asked, can the coal fleet survive for another 26 years?

The earliest retirement in Queensland is Callide B in 2027. If the losses seen this year continue and potential increase over the coming years, it does not look viable to continue operating the coal fired generators apart from providing the much-needed system security to the grid.

It is not just the Queensland Government owned assets that are affected by the subdued prices. AGL wrote down $2.68B value of its assets as their realisation of previously expensive PPA’s from the wind and the forecast long term down turn in market prices. .

AGL have recently revised their view of the market where they previously believed the current downturn in prices would be short lived and prices would return to historic levels as a signal for new generation investment. AGL have stated they expect a sustained and material reduction in the prices of power and renewable energy certificates. Of the $2.68B write down, $1.92B was attributed to onerous wind farm contracts signed between 2006 and 2012. Wholesale prices and renewable energy certificates were trading at levels, much higher than today and into the future. Adding to the write down numbers, environmental remediation of site resulted in an extra $1.11B in cost and impairment of the thermal station added just over $1B.

CEP Big Battery

An announcement was made on Friday by CEP Energy to build the World’s Biggest Battery. This comes on the back of similar announcements from other market participants in recent weeks.

This announcement is a little bit more political as the location of the 1,200MW battery is in the same location as where Scott Morrison proposes to build a new 1,000MW Gas Powered generator.

The project at Kurri Kurri in the Hunter Valley will add to CEP’s plan to build a large-scale rooftop solar and batteries VPP including 1,500MW of generation and a 400MW battery over the next 5 years. The location has the benefits of being located in an industrial precinct with connection into the NEM via an existing sub-station.

The location of the big battery is ideal for the connection of any form of generation which led to the site selection for the Morrison Governments Gas turbine but as CEP is chaired by former NSW Labor Premier Morris Lemmer and its CEO is an ex-Macquarie bank executive the reasoning for the site could be political.

If the big battery is installed it will effectively limit the capability for the federal government to build its Gas turbine.

Chairman Morris Lemma has endorsed the NSW Clean Energy Roadmap and highlighted that batteries would play a major role in filling the gaps left by the gradual retirement of coal and gas-fired generation assets.

The Kurri Kurri battery will be built in stages, with first generation expected in 2023. By 2023, if all planned batteries get built, the Kurri Kurri battery will be competing with AGLs suite of 1,000MW battery and other batteries across the NEM totaling over 2,500MW.

Solar, Wind and Thermal Generator learning to live with the challenges of the NEM.

Last week AEMO published its Quarterly Energy Dynamic report. Our Energy Experts are currently analysing the report and will provide a comprehensive summary in the next week.

The last quarter of 2020 saw some interesting trends. We saw the continual increase in wind and solar generation across the National Energy Market (NEM), reaching 20% for the first time. A deepening of the “duck curve” shape of the demand curve and the prolonged periods of negative prices mixed with volatility over the evening peaks.

Wind and solar generators are starting to learn how to operate effectively during the low-price periods, through bidding strategies or clauses in there Power Purchase Agreements (PPAs), while the thermal generators have learnt how to reduce their exposure to low prices whilst having the flexibility to ramp up during the high price period or when volatility occurs.

As expected, the regions with a higher penetration of intermittent generation like wind and solar, experienced a greater share of negative prices. Currently South Australia leads the way in the percentage of renewable generation installations but in the last quarter Victoria installed the most Wind and Solar.

With high prices in some regions and the increased occurrence of negative prices, intermittent generation altered their trading strategies by increasing the offer price to ensure the units were not dispatched at negative prices. The result of these trading strategies is that spot prices increase, and negative prices occur less.

Edge has been expecting this behavior to occur for some time. This behavior was also more prominent in the newer installations, mainly driven by market predictive software used for rebidding and the commercial drivers written into new PPAs to increase the returns from the assets.

While the wind and solar developers have steadily been increasing their presence, the thermal generators have been busy changing their operations to allow the normally inflexible coal fired generators to operate at lower minimum levels and change load rapidly to meet the change in demand and spot price during the ramp up to the evening peak.

AEMO observes that Loy Yang A showed increased flexibility by also shifting marginal capacity to higher price bands from below $10/MWh to $35/MWh so they would not dispatch volumes above their minimum load. This also leads to an increase in the spot price.

Curtailment of wind and solar increased in the quarter to 5.2% which equals an average of 191MW. Most developers should have factored in this reduction in their business models. For the ones that have not, they may be affected commercially.

In the Quarter 4 (Q4) of 2020 overall curtailment remained the same as Q3 however, economic curtailment increased. Curtailment for system strength decreased significantly as a result of fewer periods of low demand in North Queensland and changes made to the connection settings at Mt Emerald Wind Farm. The largest factor resulting in curtailment was transmission issues for system outages, grid congestion and network constraints. Curtailment due to transmission issues resulted in an average of 80MW of the 191MW being constrained in the last quarter.

Some interesting statistics out of the report that we will expand on in the coming weeks are:

  • Highest share of NEM renewable energy compared to operational demand – 36% of NEM operational demand at 0930 hours on 3 October 2020.
  • Highest grid-solar output– 3,210 MW at 1230 hours on 30 November 2020.
  • Quarterly average for grid scale Solar of 1,018MW.
  • Quarterly average of grid scale Wind generation was 2,441MW

Hydro Hedge

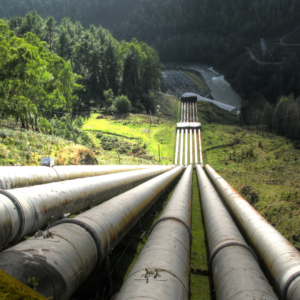
Hydro Tasmania have signed its first deal for the energy stored in its system.

The financial contract between Macquarie Group, Shell and Hydro Tasmania sells the rights to the energy stored in Hydro Tasmania’s network of water storage. Hydro Tasmania sell the right to the energy during the parts of the day when prices are high and buy energy when prices are low.

This product allows retailers and large users to manage their price risk that are increasing as the market changes with the increased penetration of intermittent generation. The deal provides 20MW of storage to Macquarie and Shell through virtual access to the stored energy.

As a risk or insurance strategy this product allows counterparties the ability to use a financial contract to replicate a battery and for battery owners the ability to hedge against their grid connected energy storage facilities.

Large-scale energy storage is currently the only option for intermittent generation such as solar and wind generators to store their excess energy when spot prices are not favorable.

This has led to an increased interest in battery storage across the National Electricity Market (NEM), with the Australian Energy Market Operator (AEMO) estimating 7,000MW of storage in the planning. The advantage of physical energy storage is that the energy can be stored when prices are low while exporting to the grid at the point when prices are high. The added benefit of physical storage is the ability for batteries to provide services to stabilise the grid when required.

As part of the planned 7,000MW of storage projects it includes the much published Snowy 2.0 which is moving ahead and the Genex storage project in North Queensland, but many other projects are not reaching financial close due to the increasing cost of pump storage hydro.

This is leading to retailers, large consumers and developers looking at other options including battery storage that is quick to build and financial products as outlined above.

New battery storage builds but, when do we have enough storage?

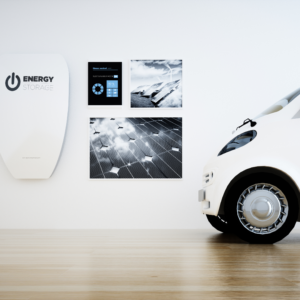
Origin Energy wants to build Australia’s largest battery, announcing a 700MW battery to be built in the NSW Hunter region.

Origin Energy plans to build the battery at its Eraring Power station site south of Newcastle. The 700MW will be able to be supplied for up to four hours making it 4 times larger than the Tesla big battery, in South Australia. The battery will be built in three stages with Stage 1 to be completed by the end of 2022.

Origin recognises their role in supporting Australia’s rapid transition to renewables and a large scale batteries ability to better support renewable energy and maintain reliable supply for customers, by having long duration storage ready to dispatch into the grid at times when renewable sources are not available.

Neoen also announced last week that it plans to build a 500MW battery capable of supplying power for two hours at the site of Wallerwang Power station near Lithgo. Neoen will again use Tesla batteries, like the South Australian Big battery, and the 300MW battery near Geelong in Victoria will be capable of supplying power for half an hour.

The planned Origin and Neoen batteries would make them the two largest storage devices in the world.

With the demise of the Coal fired generation fleet it makes sense to utilise the infrastructure available at sites such as Eraring and Wallerwang to connect the batteries to the grid, but does Australia need batteries this big?

In a recent interview with the ABC, Australian Energy Market Operator (AEMO) outlined that there are now almost 7,000MW of battery storage projects in the planning process throughout Australia with the majority across the NEM.

Even with the rapid growth of renewable energy and the potential for 7,000MW of battery storage across the NEM, Snowy Hydro is still developing its gas fired power station in the Hunter Valley.

The back-up segment of the market is also showing interest from other projects including pumped hydro and compressed air energy storage which have both secured grants from the NSW Government.

With the big battery announcements and Snowy Hydros’ 750MW gas power generation, it will be interesting to see how NSW prices and volatility will fare when the two technologies fight for supremacy in the back-up energy segment of the market. NSW will continue to push for greater renewable penetration.

COVID-19 / NEM Impact Statement

On 27 March 2020 Edge published an article written by our Senior Manager Markets & Trading, “COVID-19 / NEM Impact Statement”.

Today we revisit this article and reflect on what has transpired to date when compared to the anticipated impacts early in the pandemic.

Demand – Global and Australia

International data is starting to come through now that 2020 is behind us. From data published by the International Energy Agency (IEA) the first quarter of 2020 saw a drop of up to 20% in demand in China when full lockdowns occurred resulting in an annual reduction of 1.5%.

Globally, demand dropped 2.5% in Q120, this number may appear low but as industry dropped the demand from the residential sector increased as people were in lock down. Residential demand increased by 40% in Europe. The chart below shows the impact on demand for various regions.

It appears the reduction in demand is impacting the world in similar ways, low demands are requiring thermal plants to operate at minimum levels Rapid changes in supply when solar generation diminishes is causes ramping issues and system operators have needed to implement system security scheme to manage inertia and grid stability.

The demand profile has also changed as a result of the lockdown, a normal weekday profile now looks like a Sunday profile similar to the duck curve profile already seen in Australia.

At Home in Australia

Generation

The robustness of the Australian energy market proved itself in the early part of COVID-19 with companies such as large generators and the market operator isolating their control staff from other key staff to limit the probability of infection from other staff. These protection measures resulted in the normal operation of Power station and the grid.

Non-essential maintenance and overhauls were impacted due to COVID, as travel restrictions increased over the normal overhaul period of Q2 and Q3 this resulted in overhauls being delayed and completed in Q4 and into summer where the chance of high prices due to lower availability are much higher. The reduced availability in Q420 and Q121 has had some upside impact on the spot price with increased volatility.

Energy Prices

The charts below highlight the impact on energy prices in 2020. It should be noted however that prior to COVID-19 electricity prices were already decreasing. This commenced after the release of AEMO’s Electricity Statement of Opportunities (ESOO) in August 2019. The drop in spot prices and the forward market appear to be led by the increased penetration of renewables. As 2020 opened the drop was accelerated with COVID-19 dropping demand and the international trade of gas reducing, thus resulting in domestic gas prices dropping to unseen levels and generators all competing to dispatch their units.

By the 3rd quarter of 2020 the forward market levelled off at mid to high $40/MWh levels.

By the start of 2021 the international gas price also rebounded as a result of a cold winter in the northern hemisphere and potential easing of lockdowns once a vaccine is available.

With the reduced revenue available from lower contract prices, higher gas prices and increased demand following the easing of COVID-19 lockdowns, prices in the spot market started to increase and the forward market has followed.

AEMO

Through the pandemic AEMO did not have any significant issue directly associated with COVID-19, but changes did occur in AEMO’s interactions with participants. These changes resulted in AEMO sharing more information via online meetings, information sessions and consultations. AEMO’s role of the approver of connections and registration was not impacted by COVID-19 but the processes generally took longer due to the increased number of applications going through their systems.

On an operational front the lower demand and increased variability of supply and demand did challenge AEMO resulting in an increased need for AEMO to direct the market and either bring on more synchronous generation or curtail intermittent renewable generation as a result of the low demand and the increased penetration of renewables.

Demand and Change in demand – daily profile

Demand across Australia mirrored the trend seen overseas with demand in the commercial and industrial sectors dropping and the demand in residential consumption increasing. The daily usage profile also shifted with the morning peak occurring later and the evening peak becoming larger.

Impact of large users

The largest users in our market tend to be resources companies, including mining refining and the like. Consumption across the mining sector has been reduced as a result of the reductions in overseas demand for products primarily associated with power production and steel making. The downturn in production resulted in mining companies reducing or suspending operation to manage variable costs. With the growing demand for steel and increased coal fired generation in 2021 following the relaxing of lockdowns, the price of coal and Iron ore has increased leading to an increase in production approaching 2019 levels.

Renewables

As a result of travel bans and border lockdowns it become more difficult for developers to progress projects at the same pace.The construction and commissioning of renewable projects was delayed in 2020, however the market has still continued to grow. The percentage of renewable generation has increased across Australia, spot prices have dropped, and  coal fired generators are being pushed out of the market due to their higher marginal cost. Emissions have also dropped over 2020 due to the reduction in thermal generation and the increased renewable generation.

LGCs

Large scale generation of renewable energy was not impacted by COVID-19 so the production of LGCs did not drop as was predicted in the early part of 2020. During 2020 Australia equalled its 2019 LGC target and when final numbers are released by the Clean Energy Regulator (CER), the target could be eclipsed.

STCs

In a similar story to the Large-scale renewable sector, the small end of the market was also not impacted by COVID-19, with roof top installations and the associated STC continuing to growth. Like LGC this year STC could exceed expectations.

If you have any questions regarding this article or the electricity market in general, call Edge on 07 3905 9220 or 1800 334 336.

Back to Basics Series – National Metering Identifiers (NMIs)

We’re embarking on a series of posts that go back to basics. As electricity market experts, too often we come across people and / or businesses who lack an understanding of what can and can’t be done in the market. Inevitably we find that it is difficult to educate if the basics aren’t fully understood. 

There is no doubt that energy markets are highly complex. For example, understanding every aspect of the National Electricity Mark
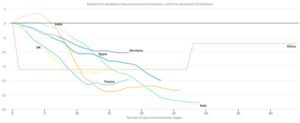
et (NEM) is near impossible. But a solid understanding of the fundamentals is essential if you stand any chance of knowing some of the more complex aspects of it.

National Metering Identifiers

A National Metering Identifier (NMI) is a unique 10 or 11 digit number used to identify every electricity network connection point in Australia. This includes all types of metered and unmetered electricity connections to the physical electricity networks in the National Electricity Market (NEM), Western Australia markets (SWIS and NWIS) and the Northern Territory.

Learning about NMIs and their function is essential. NMIs allow all the relevant players in the market to identify your network connection point and the associated services, costs and service providers associated with it. NMIs and all the data and information associated with them, are recorded in the Australian Energy Market Operator’s (AEMO’s) Market Settlement and Transfer Solutions system (MSATS), which all key service providers have access to. Put simply, MSATS is the IT system operated by AEMO to fulfil its obligations under the National Electricity Rules (NER). We’ll post on this soon.

Via MSATS, retailers become financially responsible for your NMI in the market, and therefore the costs associated with it. The energy and market costs to AEMO, the network use of system (NUOS) costs to your Network Service Provider (NSP), and the metering costs to your metering co-ordinator (MC). Your retailer is responsible for paying these costs to the relevant providers, and then recovers these costs through charges to you in your retail energy invoice.

Meter data is collected and recorded against a NMI. Any connection related works at your premises must be done with reference to a NMI (for example the installation of embedded generation). NMIs are transferred from service provider to service provider as the preferred party for these services changes, such as retailers and metering providers.

You can find your NMI on your electricity invoice. Noting a NMI will only change if there is a change to the physical connection infrastructure (for example, a change to the connection configuration or voltage) or the physical connection is removed and then later re-established.

In terms of industry speak, NMIs are often pronounced “Nim-ees” or “N M I’s”.

In the coming posts we will focus on the installation of generation at a NMI, including small scale solar PV and larger utility scale installations. How the configuration of generation can influence your consumption requirements from the market / grid and associated regulatory impacts.

Any questions, please don’t hesitate to contact us on 1800 334 336 or email save@edgeutilities.com.au or admin@edge2020.com.au