On 27 March 2020 Edge published an article written by our Senior Manager Markets & Trading, “COVID-19 / NEM Impact Statement”.
Today we revisit this article and reflect on what has transpired to date when compared to the anticipated impacts early in the pandemic.
Demand – Global and Australia
International data is starting to come through now that 2020 is behind us. From data published by the International Energy Agency (IEA) the first quarter of 2020 saw a drop of up to 20% in demand in China when full lockdowns occurred resulting in an annual reduction of 1.5%.
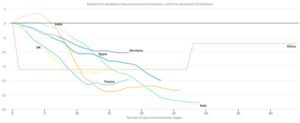
Globally, demand dropped 2.5% in Q120, this number may appear low but as industry dropped the demand from the residential sector increased as people were in lock down. Residential demand increased by 40% in Europe. The chart below shows the impact on demand for various regions.
It appears the reduction in demand is impacting the world in similar ways, low demands are requiring thermal plants to operate at minimum levels Rapid changes in supply when solar generation diminishes is causes ramping issues and system operators have needed to implement system security scheme to manage inertia and grid stability.
The demand profile has also changed as a result of the lockdown, a normal weekday profile now looks like a Sunday profile similar to the duck curve profile already seen in Australia.
At Home in Australia
Generation
The robustness of the Australian energy market proved itself in the early part of COVID-19 with companies such as large generators and the market operator isolating their control staff from other key staff to limit the probability of infection from other staff. These protection measures resulted in the normal operation of Power station and the grid.
Non-essential maintenance and overhauls were impacted due to COVID, as travel restrictions increased over the normal overhaul period of Q2 and Q3 this resulted in overhauls being delayed and completed in Q4 and into summer where the chance of high prices due to lower availability are much higher. The reduced availability in Q420 and Q121 has had some upside impact on the spot price with increased volatility.
Energy Prices
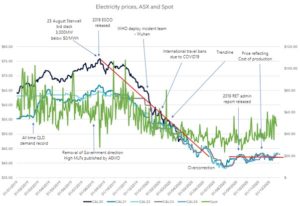
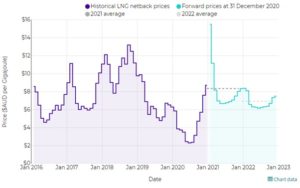
The charts below highlight the impact on energy prices in 2020. It should be noted however that prior to COVID-19 electricity prices were already decreasing. This commenced after the release of AEMO’s Electricity Statement of Opportunities (ESOO) in August 2019. The drop in spot prices and the forward market appear to be led by the increased penetration of renewables. As 2020 opened the drop was accelerated with COVID-19 dropping demand and the international trade of gas reducing, thus resulting in domestic gas prices dropping to unseen levels and generators all competing to dispatch their units.
By the 3rd quarter of 2020 the forward market levelled off at mid to high $40/MWh levels.
By the start of 2021 the international gas price also rebounded as a result of a cold winter in the northern hemisphere and potential easing of lockdowns once a vaccine is available.
With the reduced revenue available from lower contract prices, higher gas prices and increased demand following the easing of COVID-19 lockdowns, prices in the spot market started to increase and the forward market has followed.
AEMO
Through the pandemic AEMO did not have any significant issue directly associated with COVID-19, but changes did occur in AEMO’s interactions with participants. These changes resulted in AEMO sharing more information via online meetings, information sessions and consultations. AEMO’s role of the approver of connections and registration was not impacted by COVID-19 but the processes generally took longer due to the increased number of applications going through their systems.
On an operational front the lower demand and increased variability of supply and demand did challenge AEMO resulting in an increased need for AEMO to direct the market and either bring on more synchronous generation or curtail intermittent renewable generation as a result of the low demand and the increased penetration of renewables.
Demand and Change in demand – daily profile
Demand across Australia mirrored the trend seen overseas with demand in the commercial and industrial sectors dropping and the demand in residential consumption increasing. The daily usage profile also shifted with the morning peak occurring later and the evening peak becoming larger.
Impact of large users
The largest users in our market tend to be resources companies, including mining refining and the like. Consumption across the mining sector has been reduced as a result of the reductions in overseas demand for products primarily associated with power production and steel making. The downturn in production resulted in mining companies reducing or suspending operation to manage variable costs. With the growing demand for steel and increased coal fired generation in 2021 following the relaxing of lockdowns, the price of coal and Iron ore has increased leading to an increase in production approaching 2019 levels.
Renewables
As a result of travel bans and border lockdowns it become more difficult for developers to progress projects at the same pace.The construction and commissioning of renewable projects was delayed in 2020, however the market has still continued to grow. The percentage of renewable generation has increased across Australia, spot prices have dropped, and coal fired generators are being pushed out of the market due to their higher marginal cost. Emissions have also dropped over 2020 due to the reduction in thermal generation and the increased renewable generation.
LGCs
Large scale generation of renewable energy was not impacted by COVID-19 so the production of LGCs did not drop as was predicted in the early part of 2020. During 2020 Australia equalled its 2019 LGC target and when final numbers are released by the Clean Energy Regulator (CER), the target could be eclipsed.
STCs
In a similar story to the Large-scale renewable sector, the small end of the market was also not impacted by COVID-19, with roof top installations and the associated STC continuing to growth. Like LGC this year STC could exceed expectations.


